Triangulation Rapid Risk Assessment
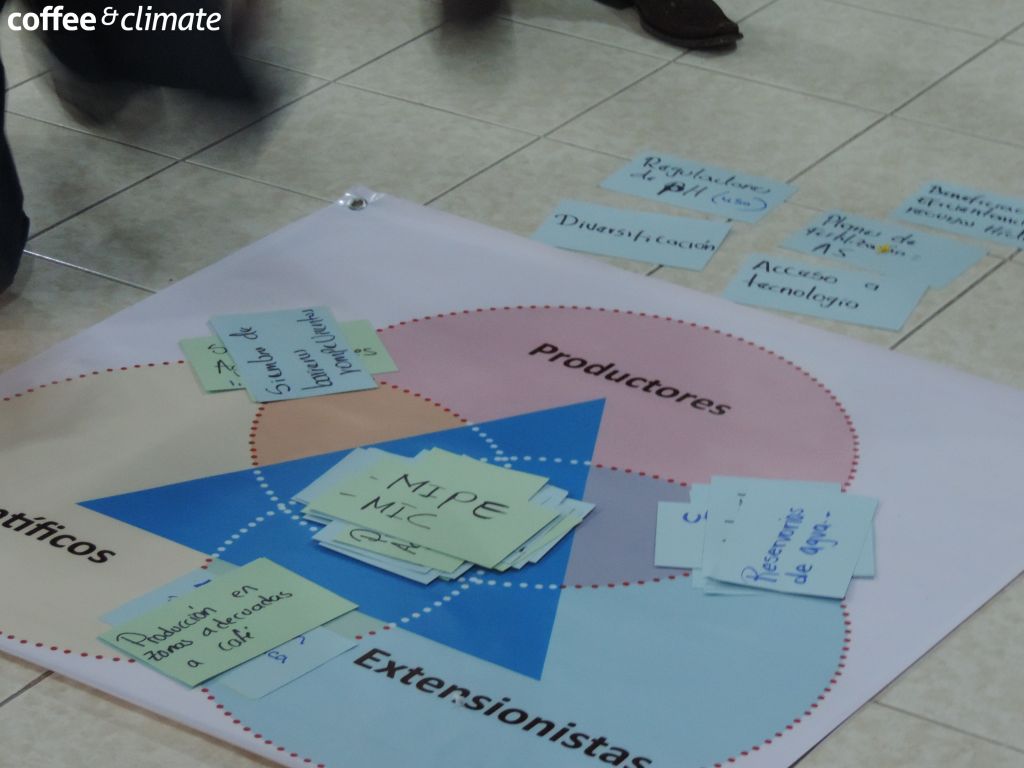
The effects of climate change vary according to the locality, so it is vital to assess local risks. ‘Triangulating’ information collected from local experts, farmers and scientific data will help to create a clear impression of the most extreme climate change effects facing a particular area, and where all three sources concur will provide a good pointer of where to begin adaptation activities.
Status: risk assessments are widely used to assess local vulnerabilities, but they sometimes become overly complex and time-consuming.
Concept
Risk assessments sometimes take too long and become an end in themselves, rather than a guide to immediate action. The main intention of the Triangulation process is to collect a wide range of data, collate them and then quickly start implementation of tools to reduce the identified risks and problems. Triangulation involves collecting information on the effects of climate change at the local level from three sources:
- Farmers – have first-hand experience of very local conditions that may reach back several decades. By interviewing a number of them (preferably 30 or more), clear effects often become apparent (e.g. changes in wet season onset, more intense rain etc.).
- Local experts (extensionists, scientists) – have a less intimate knowledge of any specific locality but often a greater grasp of zonal changes and past extreme incidents and may possess more quantitative data.
- Scientific data – meteorological records, previous studies (published and unpublished) that provide the most quantitative information, though often very generalized and out of date.
By eliciting information from these different sources, typically a clear impression of the most extreme climate change effects becomes apparent. Topics where all three sources concur are a good pointer of where to begin adaptation activities. It is best to begin field trials to address one of the principal risk factors identified by farmers.
Drawbacks
- None: it is essential to collect local data and match this to other sources of data in order to tackle relevant climate problems.
Costs
- Depends greatly on local logistics and level of precision required. All risk assessments take time and effort to collect useful data.
Recommended Activities
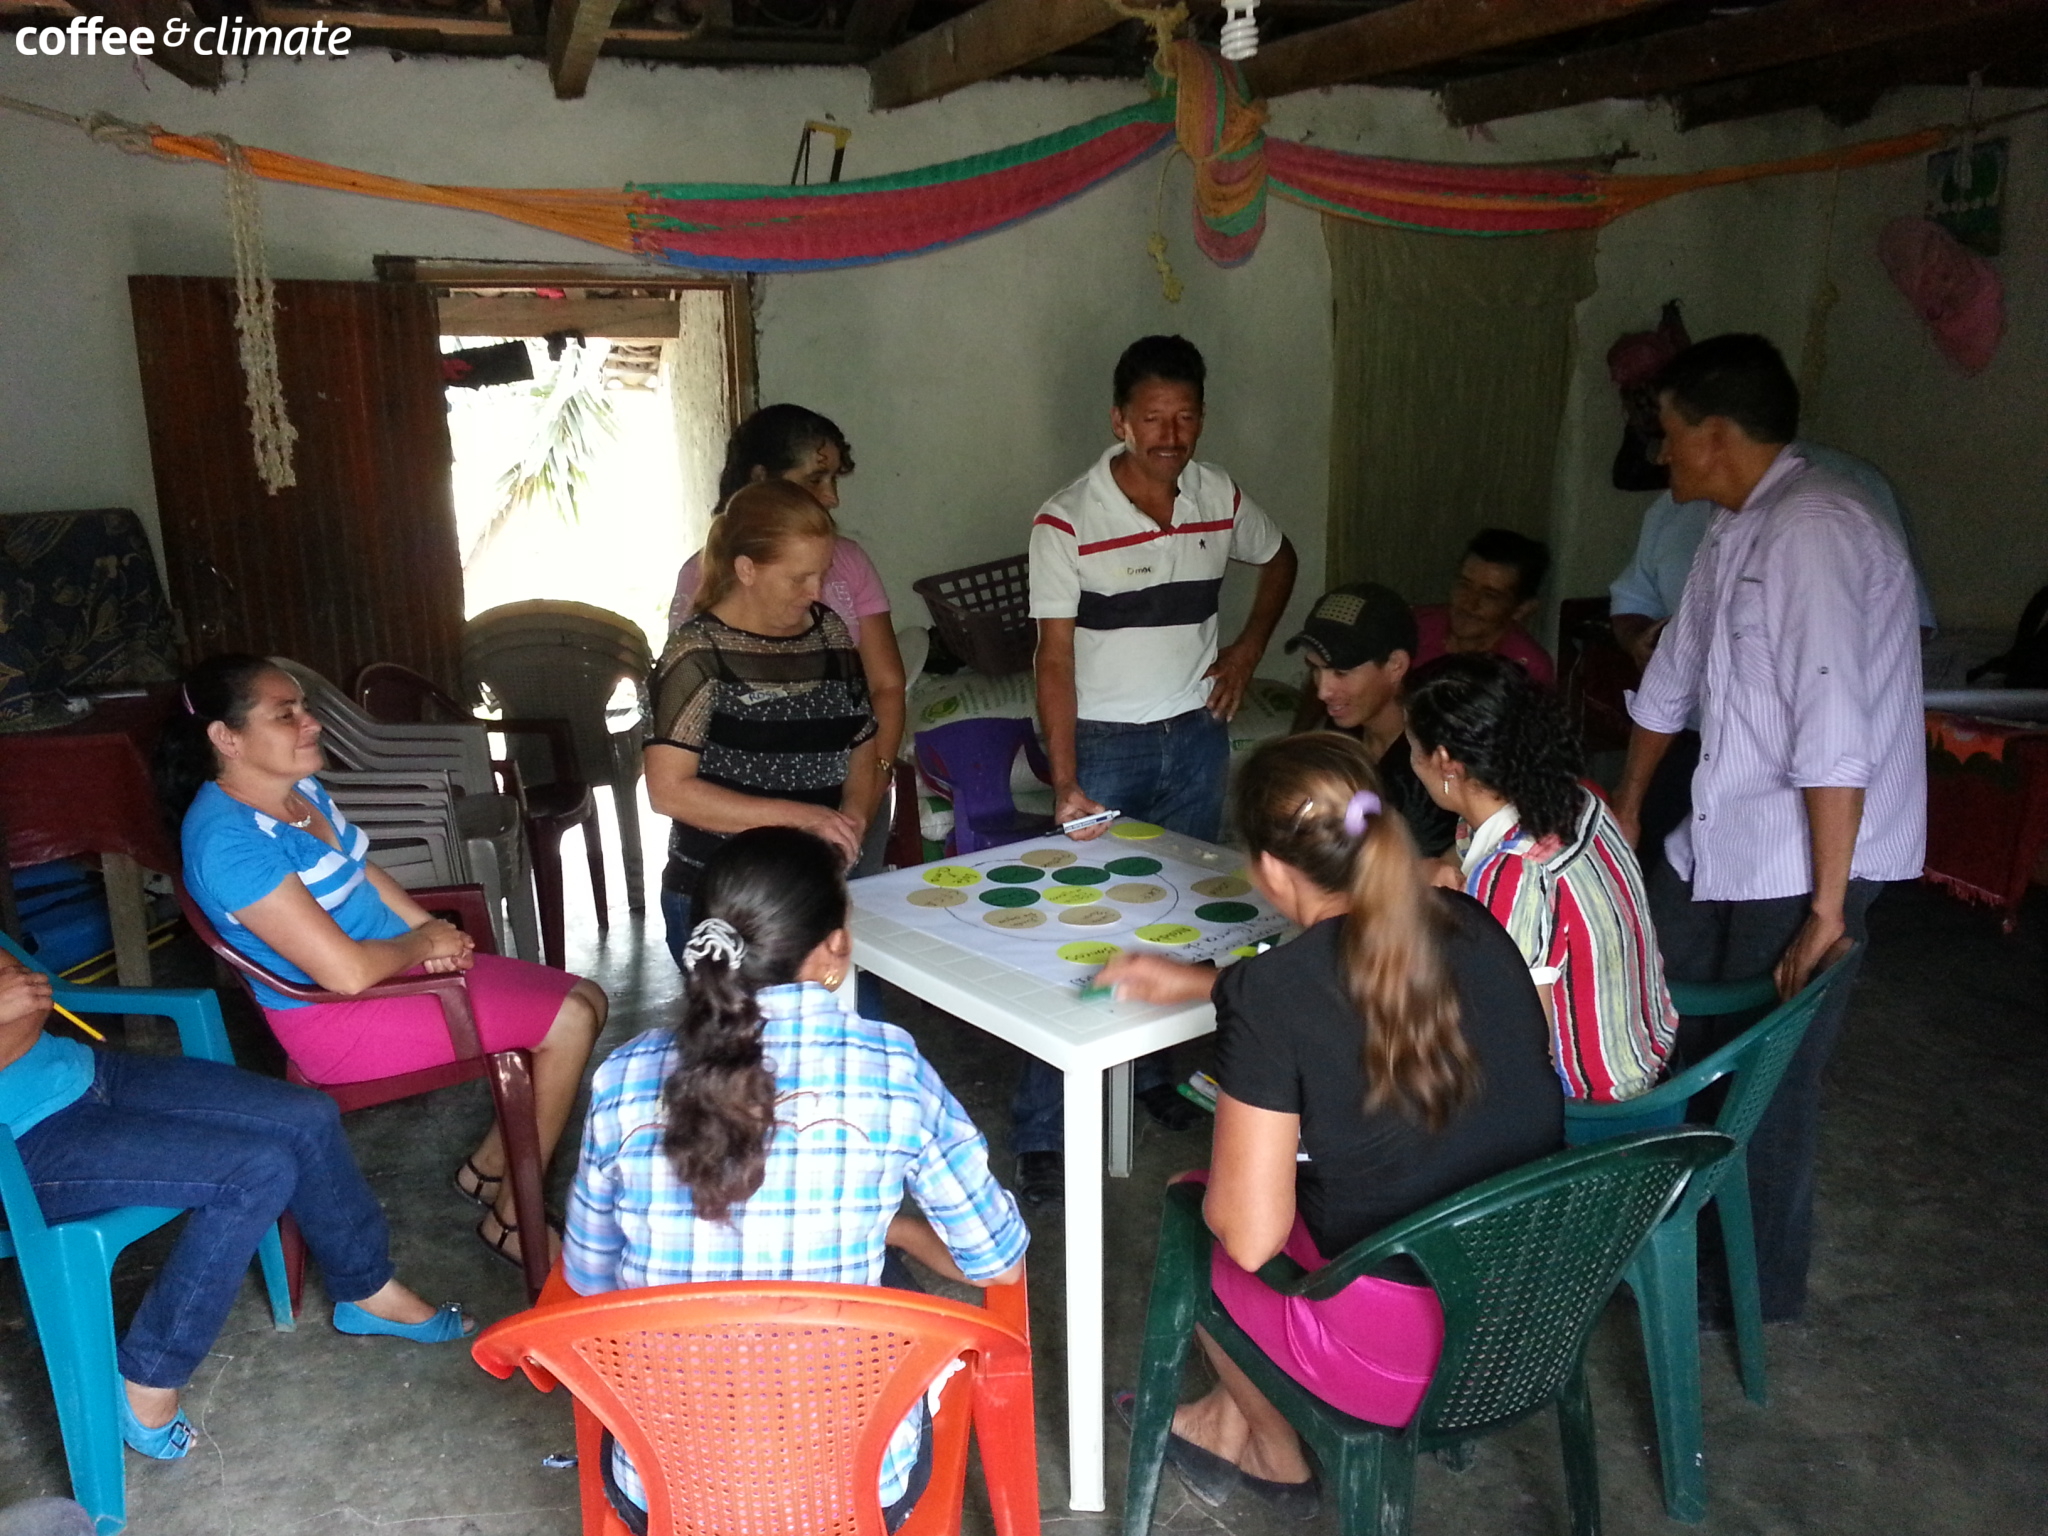
- Identify zone(s) of interest and arrange meetings with farmers. It is better not to mention climate change initially but instead to start by asking some general questions about production problems, e.g.: ‘tell me about your main production worries’.
- Collect information organically. There are a number of well-known elicitation techniques –ranking exercises, time-lines, individual interviews (structured or informal), among others – choose the best approach based on the local context and available expertise.
- Record all information and turn it into semi-quantitative data wherever possible (e.g. ranking of most pressing problems, counts (percentages) of farmers citing different climate threats, Likert scaling etc.).
- Visit a number of farms in each zone so that problems can be assessed directly. Take temperature (soil, air) and altitude readings, especially if visits coincide with hot sunny conditions, so that at least maximum temperatures can be roughly assessed (often these turn out to be above tolerable limits).
- Conduct expert interviews in a similar manner; these can usually be carried out more quickly.
- Collect available meteorological and scientific data (previous studies both published and in the grey literature). This can be challenging because often data is available in very summarized form (e.g. long term averages that may be decades out of date) or ‘raw’ (unanalyzed and undigitized). Care must be taken when consulting local meteorological data, since it may be incomplete or inaccurate due to antiquated instrumentation and lack of trained operatives.
- Draw conclusions. Based on all data sources, write a report to highlight the most probable climate risks for the zone of interest, looking especially for concordance between the three sources of information.
Further Activities
- It is advisable to do a second assessment after a year or so, especially if the first assessment was made during an extreme event (e.g. rust outbreak) which may have caused some bias in responses given.
- Have something to add to this tool description? Leave a comment!
- Interested in applying this tool? Look for pictures, case studies and info sheets below for step-by-step instructions to get you started.


Leave a comment
0 comments