On-Farm Climate Monitoring
Measuring and recording the air and soil temperature on your farm has become much cheaper, allowing plot level temperature and humidity to be measured, logged and downloaded for quick analysis. The data is useful a) to determine how extreme the climate may have become in a particular location; b) to quickly register the efficacy of any adaptation interventions, so that adjustments or alternatives can be found if required.
Status: under test with promising results. Recent advances in technology mean that it is now possible to measure and record weather data at the plot level; c&c and others have been testing this technology in conjunction with farm adaptation practices.

Concept
Because climate change has led to temperature rises of up to 1 C over the past 30 years, some farms may now be regarded as in a marginal zone or exposed to dangerous extremes – e.g. very high temperatures during flowering. Most farmers themselves have little idea what might be the temperature and rainfall regime of their farms, which may be particularly important if they are hoping to produce premium coffee. Daily measurements of temperature (air and soil) and relative humidity can now be recorded discretely at quite low cost and in a fashion which requires no day-to-day interventions. Rainfall loggers are also possible, though more bulky and because they are prone to blockages, require regular checking. Hence it is now feasible to use monitoring devices to determine the overall climatic status of the farm and quickly measure the efficacy of adaptation interventions. Such in-plot measurements can be used as a proxy measurement for adaptation, which is a difficult thing to measure directly because it make take years to prove that an intervention produces the desired effect on resilience, yields, profit etc.
Drawbacks
- Minimal. Previous measuring devices have either been a) simple devices that require daily readings to be recorded which farmers are reluctant to carry out or b) bulky and expensive automated equipment where the risk of deployment and subsequent loss has been discouraging. The new generation of devices makes these problems increasingly obsolete.
- Sensors tested to date have a reasonably low failure rate, but it is advisable to download data frequently (i.e. within weeks rather than months).
- Problems with downloading of data have been reported and technicians should become thoroughly familiar with the process before field deployment.
- All datalogging devices generate large amounts of data. Hence a storage and analysis methodology should be established so that data can be swiftly analysed.
Costs
- Less than 50USD for a simple temperature sensor that will transmit data to a mobile phone app.
Recommended Activities
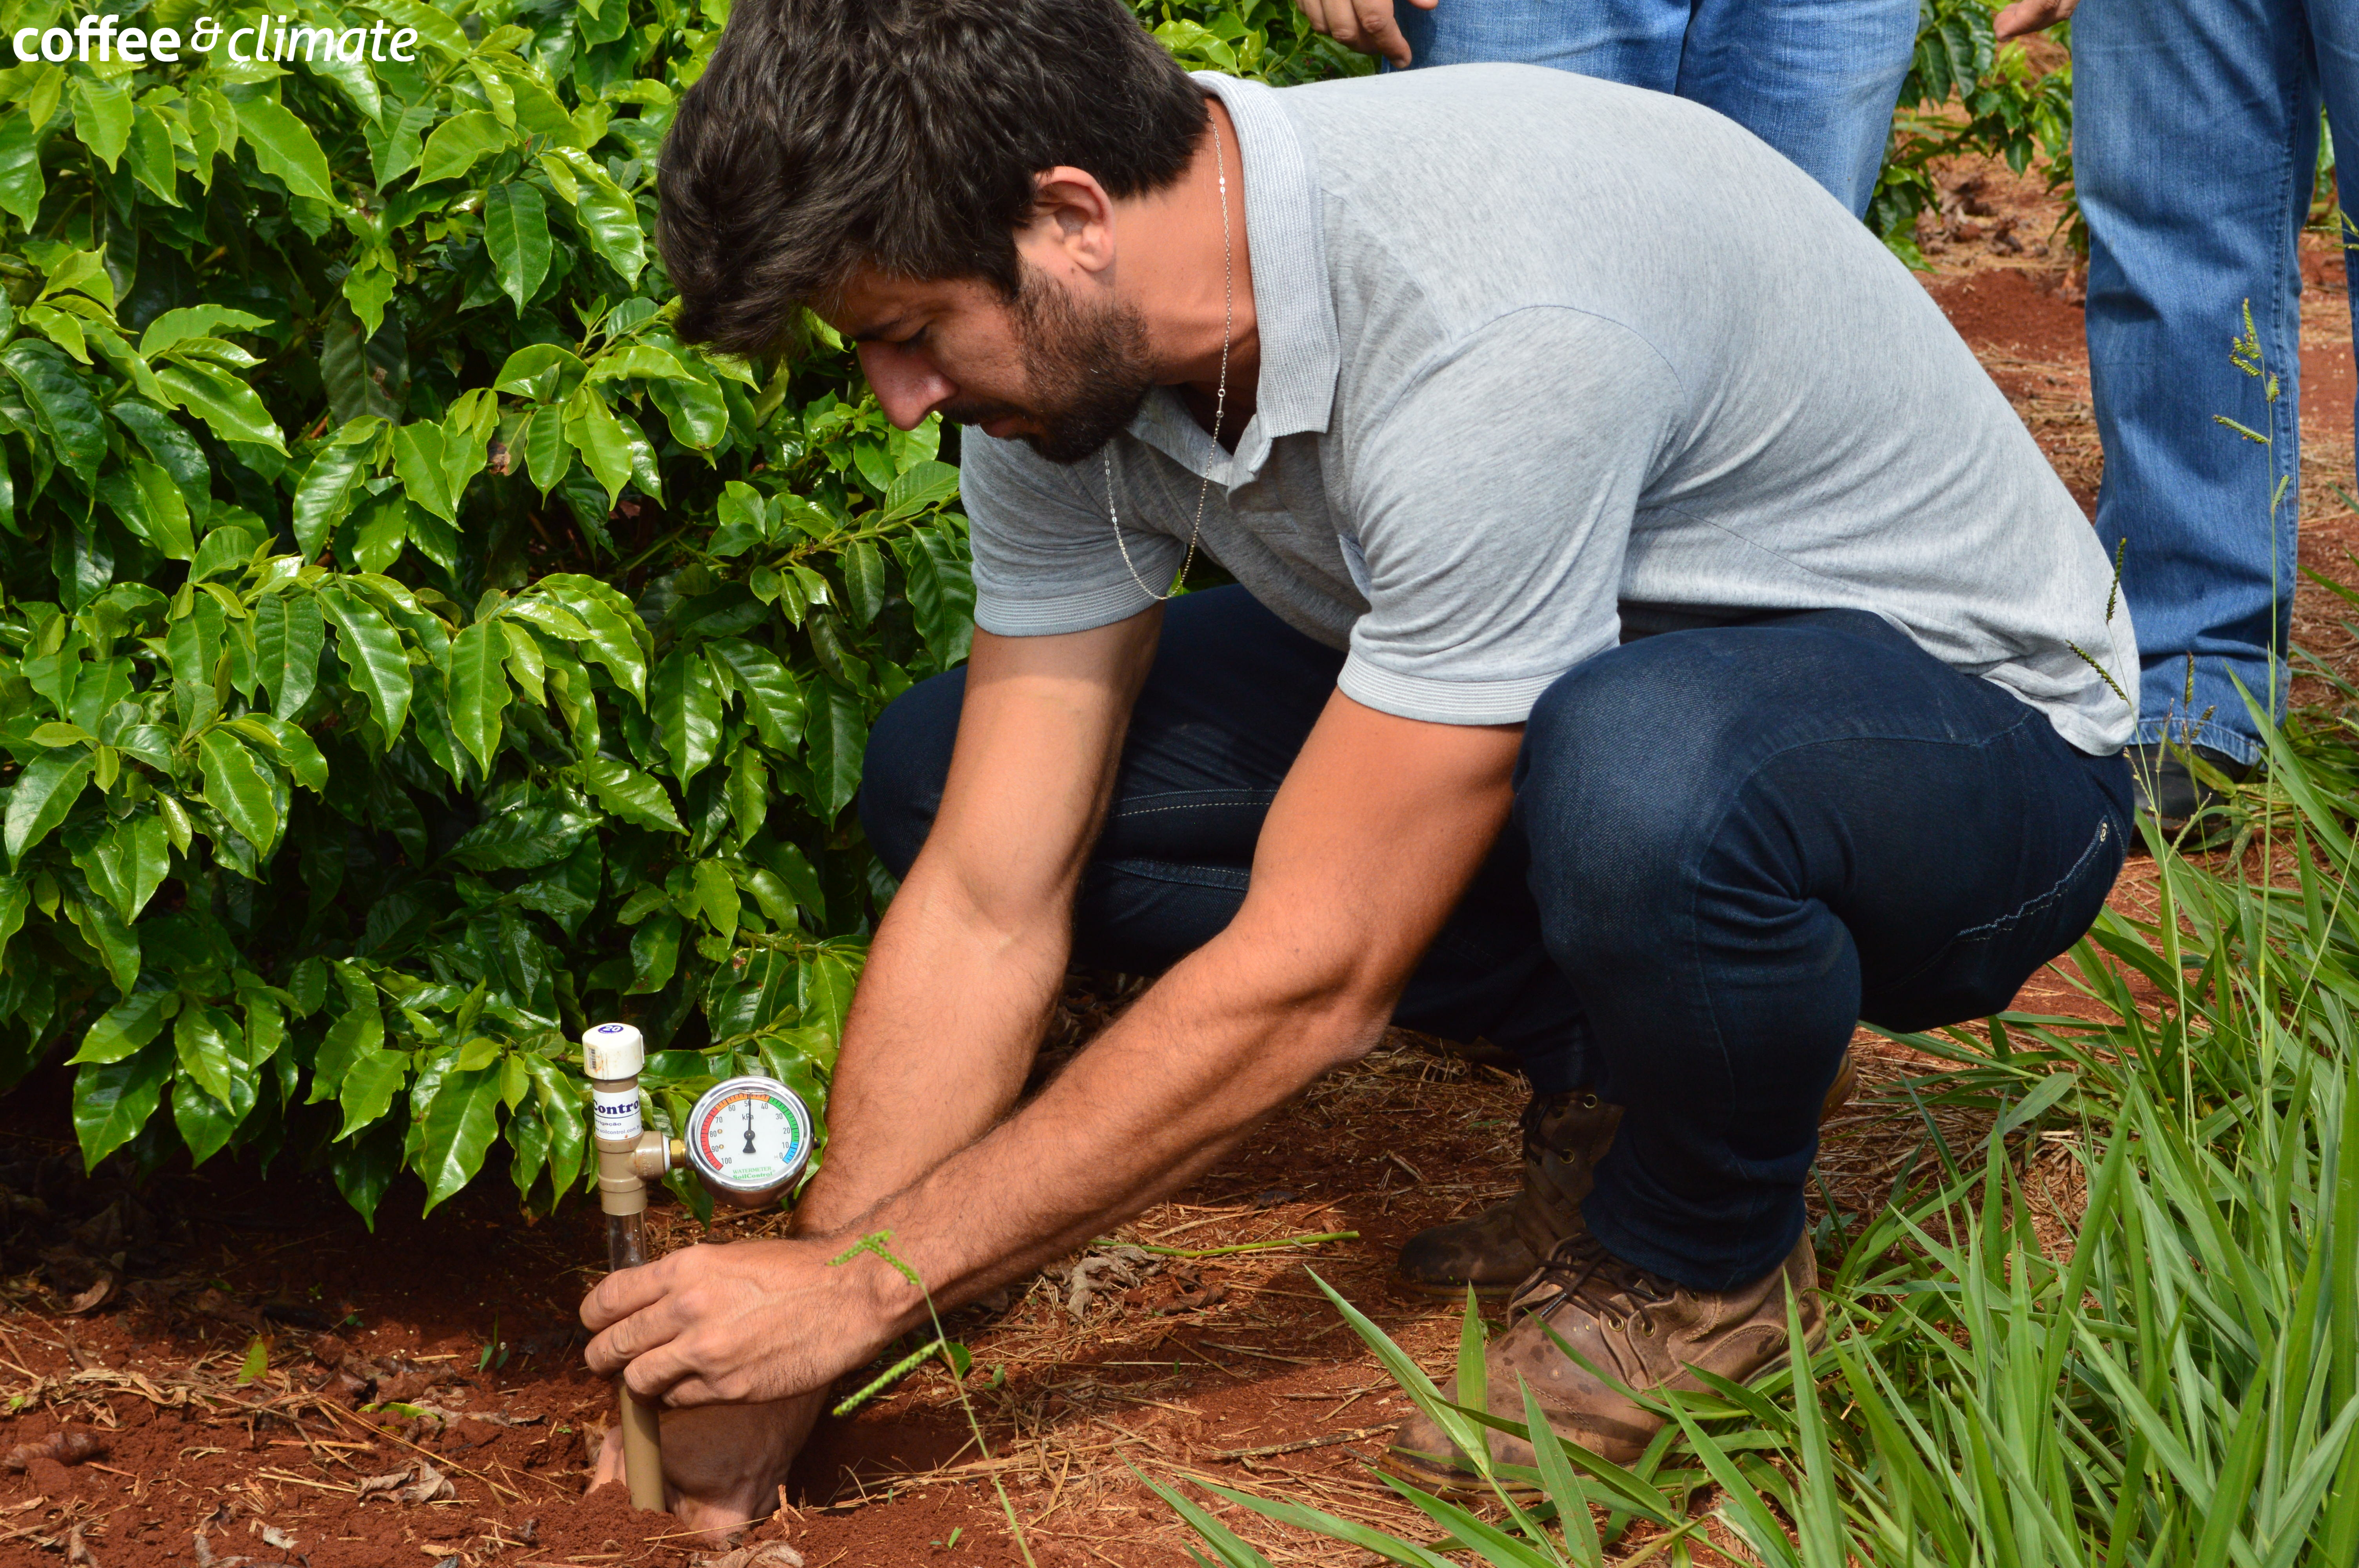
- Install temperature sensors and data-loggers in the soil and on trees. Combined temperature sensors and data-loggers such as i-buttons, smart-buttons or Peanuts weigh only a few grams and can read and record hourly data, which they store for months if needed.
- To approximate standard meteorological monitoring conditions, air temperature and humidity monitors should be placed away from direct sunlight at a height of about 1.5 m (e.g. it could be attached to the stem of a coffee tree). There is no universal standard soil depth for a temperature sensor, but for coffee, c&c have placed sensors at 50 mm depth where feeder roots are found.
- If possible several sensors should be used to record conditions for a range of crop conditions (e.g. shade and soil cover).
- Download data monthly or more frequently if convenient.
- Analyze your data. Graph your results in a spreadsheet, and look for ranges, means and extreme values, especially at the hottest times of the year.
- Discuss results with farmers.
- Adapt as needed. If maximum air temperatures regularly exceed 30 C, and soil temperatures (50 mm depth) are regularly veering towards 30C (ideal should be below 25 C) then it is suggested to employ adaptation options (see other tools).
Further Activities
- Agriculture is experiencing a ‘big data’ revolution and the monitoring and analysis of field data is an area of increasingly intense activity.
- Downloading of data to mobile phones with automatic analysis and alerts will make monitoring increasingly routine and user-friendly.
- Have something to add to this tool description? Leave a comment!
- Interested in applying this tool? Look for pictures, case studies and info sheets below for step-by-step instructions to get you started.
Leave a comment
0 comments