Climatic Zoning
For planning purposes it is useful to determine which coffee lands can be categorized as optimal, sub-optimal or unsuitable and how these have been changing in recent years. One way to do so has been to evaluate current and past annual temperature and rainfall; using this approach, coffee is ideally grown in zones with temperatures between 18C° and 21C° (with sub-optimal temperatures between 22-23C°) and with rainfall of a minimum of 1200mm per year. A second evaluation method has emerged recently, using a machine learning computer program to relate current locations where coffee is produced with a number of future projections for climate variables for the same locations, to determine if coffee will continue to be suitable for growth in those locations in 2030 and 2050.
Status: different zoning methods have been developed, most notably in Brazil where the results are used to advise farmers on correct crops for each climatic zone.
Concept
Two main methods have been used: 1. Classical Based upon mean annual temperature range (which is either 18C° to 21C° or 18C° to 22C° according to different authorities) and rainfall (roughly between 1200mm/yr and 2500mm/yr). There is also a sub-optimal zone that is less well established – mostly it allows for an annual mean temperature as low as 17C° and as high as 23C°. Temperatures below 17C° are problematic because of long flower dormancy and slow harvest maturation which leads to overlap of berry ‘cohorts’. Arabica can apparently be grown at a mean of 25C° if it receives enough water (irrigation) and maintained in high nutritional status. 2. Modern Using presence and absence data of where coffee is grown, a machine learning computer program relates location of each data point to 19 climate variables (e.g. mean temperature of the driest quarter, precipitation of the wettest month etc.) that are estimated for that same location. Gradually the program calculates a suitability vs altitude curve for coffee growing.
Drawbacks
- Tough to measure on your own. Both methods require considerable programming and data to create a meaningful analysis.
- Conclusions vary. The machine learning method tends to produce unfeasibly broad distribution curves that conflict with results from the classical method.
- Projections are not fact.
Costs
- Expensive: current methods require considerable expert input.
Recommended Activities
- For those farms where temperature and rainfall are known (i.e. near a meteorological station or where a farm has its own temperature and rainfall records) it is relatively simple to roughly estimate current suitability for coffee growing as follows:
- From the data calculate:
- mean annual temperature (Ta) for the past few years (ideally at least 10 years).
- mean monthly temperatures with the same data for Jan to Dec.
- mean annual (Pa) and monthly rainfall for Jan to Dec.
- Ideally, Ta should lie between 18C° and 21C°. 22C° is still acceptable but is approaching marginal for good quality coffee. Over 23C° is definitely marginal and is liable to lead to significantly lighter beans as the cherry matures faster than the endosperm can achieve maximum density.
- Rainfall should be at least 1200mm/year. Typically Arabica transpires 3mm to 4mm rainfall per day (depending on local conditions, shading, soil type etc.). If there is a period with a rainfall deficit of more than 150mm (i.e. little rain for 40 to 50 days) then the trees will be most likely to start suffering drought stress.
- Plot mean monthly rainfall vs mean monthly temperature and connect the points to produce a polygon (see Figure below). Look for months where the temperature is particularly high or low especially if the high temperatures coincide with months of low rainfall. An ‘ideal’ polygon should have no more than three months with low rainfall and few months with temperatures above 22C°.
- Separately plot individual years (especially Niño and Niña years) to look for variations; too often important information can be lost by using only long term means.
- In many coffee zones, farms formerly considered ideal are now trending towards marginality.
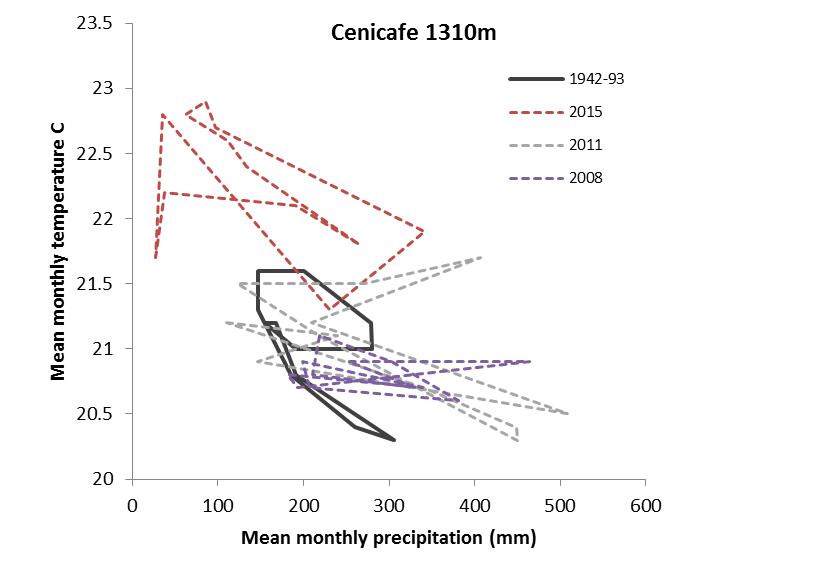
Figure: Climogram for Cenicafe, Caldas, Colombia – the historic values (black) are now greatly exceed in hot years (red) whereas cool Niña years are now similar to long term averages.
Conclusion: coffee is still viable at this altitude with mostly abundant rainfall, but higher trending values in hot years suggest specific adaptation activities may be required.
- Have something to add to this tool description? Leave a comment!
- Interested in applying this tool? Look for pictures, case studies and info sheets below for step-by-step instructions to get you started.


Leave a comment
0 comments